
Our Project Results
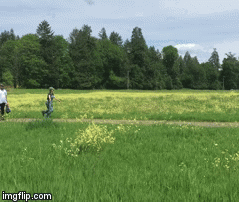

Figure 1: We recorded a very high survivability rate for all 2015 plantings, except the Vine Maple (Acer circinatum).

Figure 2: All plantings grew steadily from 2015 to 2016, particularly Salix spp. Negative growth apparent for the Red-osier Dogwood was attributed to elk and cow browsing as well as upland planting placement.


Figure 3: Average percent cover of functional groups measured in 1m x 1m subplots during baseline monitoring of the Phase II planting area. Woody invasive species includes Himalayan blackberry. Grass-like invasive species includes reed canarygrass. Herbaceous invasives include European swamp thistle (Cirsium palustre). Other vegetative cover includes native species and non-native, non-invasives.
Figure 5: This graph shows the dIfferences in data for average water temperature between 2015 and 2016 for lower Goose Creek.
Species Code Key
The Fresh Water Trust Baseline Monitoring
ELP Protocol 2015/2016 Planting Monitoring
Stream Temperature Monitoring
Pollinator Survey

Figure 4: Compared to the 2015 data, we observed a lower frequency of all pollinators occurring along the transects. 2015’s team observed bumblebees (Bombus sp.) most frequently with an average of 22 bumblebees per survey at high confidence, when combining all transect locations. These observations were consistent with this year’s recordings; bumblebees were the most frequent pollinator detected with the average being 9 bumblebees per survey at high confidence, again combining all transects.
Aquatic Macroinvertebrate Survey
Figure 6: According to the McKenzie Watershed Council’s protocol, all three locations where the water temeprature survey's took place are considered poor quality.
